Topography of the Cape Cod National Seashore
A project done with collaborations from US Geological Survey (USGS) Florida Integrated Science Center (FISC) St. Petersburg, Florida, the National Park Service (NPS), Northeast Coastal and Barrier Network, Inventory and Monitoring Program, and the National Aeronautics and Space Administration (NASA) produced several topography maps of seashores in the US, one of these was the Cape Cod National Seashore. The objective in mapping the seashores is to monitor any changes that take place, map coastal vegetation and sandy beaches, and create an assessment of what to do in events, such as severe storms. It can also be used to monitor coral reefs.
What sensor is used to map the topography?
The instrument used to map the landscapes is Experimental Airborne Advanced Research LiDAR (EAARL). A laser mounted on board an aircraft sends a pulse to the ground. The laser impulses bounce off of the surface and the system then measures the amount of time difference between sending the laser signal out and receiving it back at the sensor. The system operates in the blue-green portion of the electromagnetic spectrum. The narrow swath, only about 240 meters, make it useful in coastal surveying as large changes can occur in a small area. The aircraft flies at an elevation of about 300 meters and data is captured has about 13.9 centimeters resolution. For more information on LiDAR please visit the Sensors page.
Data
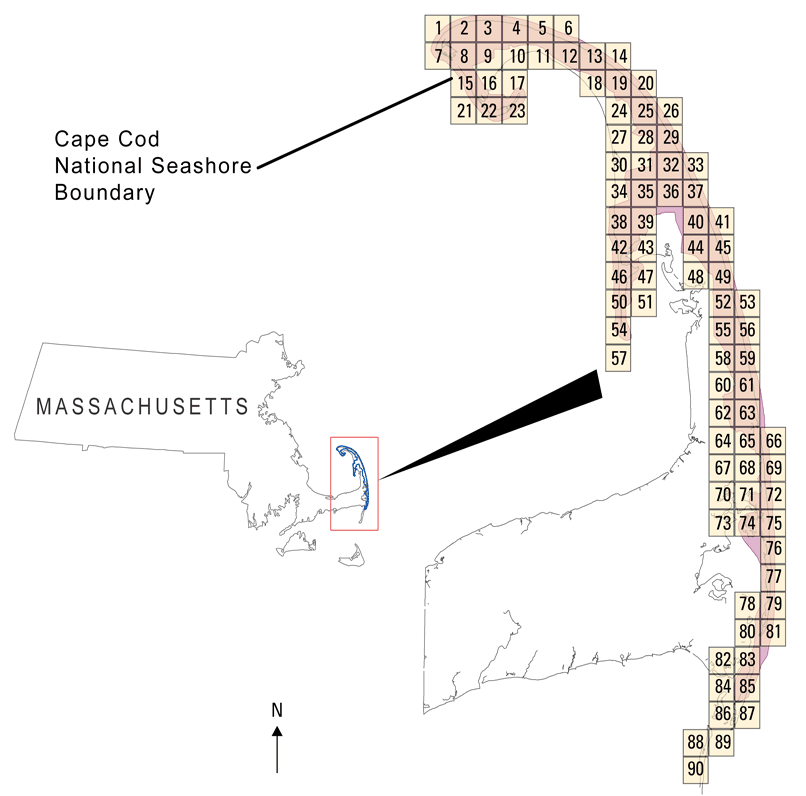
Image 8 shows the Cape Cod National Seashore and locations of where EAARL collected data. Clicking on this image will take you to the USGS website where all the elevation data is stored.
The elevation data area surveyed by EAARL can be seen in Image 7. Image 7 is hyperlinked to the USGS website where all the data is stored in PDFs and can also be downloaded as shapefiles to use in GIS.
Importance
The mapping the topography of the Cape Cod National Seashore is very important. It is important to monitor the different elevations because it can help evaluate the impact of sea level rise and flooding from coastal storms, and help predict how future sea level rise from global warming will influence the Cape Cod National Seashore.

Image 7 shows how LiDAR is used in mapping coastal areas. Click on the image to enlarge it.
